形状
| 站点: | 聚观点-集成开发环境 |
| 课程: | 必修1. 互联网创意编程基础 |
| 图书: | 形状 |
| 打印: | 访客用户 |
| 日期: | 2026年05月25日 星期一 09:44 |

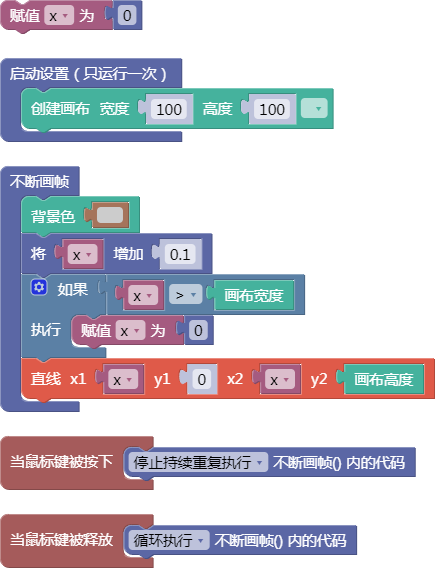
1.2. 直线
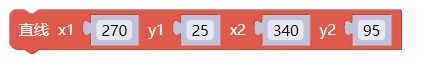
line()
示例:

let x = 0;
function setup() {
  createCanvas(100, 100);
}
function draw() {
  background(204);
  x = x + 0.1;
  if (x > width) {
    x = 0;
  }
  line(x, 0, x, height);
}
function mousePressed() {
  noLoop();
}
function mouseReleased() {
  loop();
}
舞台区显示的画布内容如下:

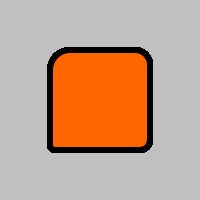
1.3. 矩形(顶点位置)

rect()
示例:
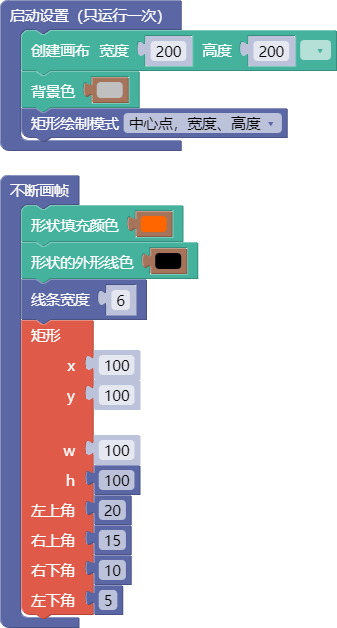
function setup(){
  createCanvas(200,200);
  background('#c0c0c0');
  rectMode(CENTER);
};

function draw(){
  fill('#ff6600');
  stroke('#000000');
  strokeWeight(6);
  rect(100,100,100, 100, 20, 15, 10, 5);
};
舞台区显示的画布内容如下:
Description
Draws a rectangle on the canvas. A rectangle is a four-sided closed shape with every angle at ninety degrees. By default, the first two parameters set the location of the upper-left corner, the third sets the width, and the fourth sets the height. The way these parameters are interpreted may be changed with the rectMode() function.
The fifth, sixth, seventh and eighth parameters, if specified, determine corner radius for the top-left, top-right, lower-right and lower-left corners, respectively. An omitted corner radius parameter is set to the value of the previously specified radius value in the parameter list.
Syntax
rect(x, y, w, [h], [tl], [tr], [br], [bl])rect(x, y, w, h, [detailX], [detailY])Parameters
- xNumber:
x-coordinate of the rectangle.
- yNumber:
y-coordinate of the rectangle.
- wNumber:
width of the rectangle.
- hNumber:
height of the rectangle.
(Optional) - tlNumber:
optional radius of top-left corner.
(Optional) - trNumber:
optional radius of top-right corner.
(Optional) - brNumber:
optional radius of bottom-right corner.
(Optional) - blNumber:
optional radius of bottom-left corner.
(Optional) - detailXInteger:
number of segments in the x-direction (for WebGL mode)
(Optional) - detailYInteger:
number of segments in the y-direction (for WebGL mode)
(Optional)
1.4. 矩形(段数)
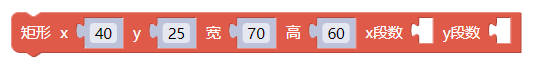
rect()
示例:

let x = 0;
function setup() {
  createCanvas(100, 100);
}
function draw() {
  background(204);
  x = x + 0.1;
  if (x > width) {
    x = 0;
  }
  line(x, 0, x, height);
}
function mousePressed() {
  noLoop();
}
function mouseReleased() {
  loop();
}
舞台区显示的画布内容如下:

1.5. 四角形

quad()
示例:

let x = 0;
function setup() {
  createCanvas(100, 100);
}
function draw() {
  background(204);
  x = x + 0.1;
  if (x > width) {
    x = 0;
  }
  line(x, 0, x, height);
}
function mousePressed() {
  noLoop();
}
function mouseReleased() {
  loop();
}
舞台区显示的画布内容如下:

1.7. 弧形
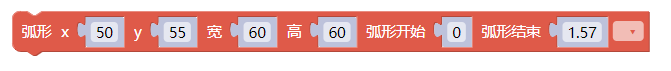
arc()
示例:

let x = 0;
function setup() {
  createCanvas(100, 100);
}
function draw() {
  background(204);
  x = x + 0.1;
  if (x > width) {
    x = 0;
  }
  line(x, 0, x, height);
}
function mousePressed() {
  noLoop();
}
function mouseReleased() {
  loop();
}
舞台区显示的画布内容如下:

1.8. 正方形

square()
示例:

let x = 0;
function setup() {
  createCanvas(100, 100);
}
function draw() {
  background(204);
  x = x + 0.1;
  if (x > width) {
    x = 0;
  }
  line(x, 0, x, height);
}
function mousePressed() {
  noLoop();
}
function mouseReleased() {
  loop();
}
舞台区显示的画布内容如下:

1.9. 三角形
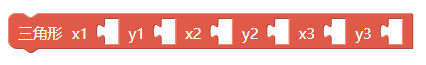
triangle()
示例:

let x = 0;
function setup() {
  createCanvas(100, 100);
}
function draw() {
  background(204);
  x = x + 0.1;
  if (x > width) {
    x = 0;
  }
  line(x, 0, x, height);
}
function mousePressed() {
  noLoop();
}
function mouseReleased() {
  loop();
}
舞台区显示的画布内容如下:

2.1. 矩形绘制模式
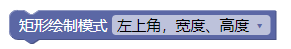
rectMode()
示例:

let x = 0;
function setup() {
  createCanvas(100, 100);
}
function draw() {
  background(204);
  x = x + 0.1;
  if (x > width) {
    x = 0;
  }
  line(x, 0, x, height);
}
function mousePressed() {
  noLoop();
}
function mouseReleased() {
  loop();
}
舞台区显示的画布内容如下:

2.3. 线条顶点风格
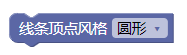
strokeCap()
示例:

let x = 0;
function setup() {
  createCanvas(100, 100);
}
function draw() {
  background(204);
  x = x + 0.1;
  if (x > width) {
    x = 0;
  }
  line(x, 0, x, height);
}
function mousePressed() {
  noLoop();
}
function mouseReleased() {
  loop();
}
舞台区显示的画布内容如下:

2.4. 线条连接风格
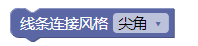
strokeJoin()
示例:

let x = 0;
function setup() {
  createCanvas(100, 100);
}
function draw() {
  background(204);
  x = x + 0.1;
  if (x > width) {
    x = 0;
  }
  line(x, 0, x, height);
}
function mousePressed() {
  noLoop();
}
function mouseReleased() {
  loop();
}
舞台区显示的画布内容如下:

2.5. 线条宽度

strokeWeight()
示例:

let x = 0;
function setup() {
  createCanvas(100, 100);
}
function draw() {
  background(204);
  x = x + 0.1;
  if (x > width) {
    x = 0;
  }
  line(x, 0, x, height);
}
function mousePressed() {
  noLoop();
}
function mouseReleased() {
  loop();
}
舞台区显示的画布内容如下:

2.6. 禁用/启用平滑形状
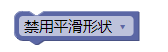
noSmooth()
示例:

let x = 0;
function setup() {
  createCanvas(100, 100);
}
function draw() {
  background(204);
  x = x + 0.1;
  if (x > width) {
    x = 0;
  }
  line(x, 0, x, height);
}
function mousePressed() {
  noLoop();
}
function mouseReleased() {
  loop();
}
舞台区显示的画布内容如下:

3.1. 贝塞尔曲线
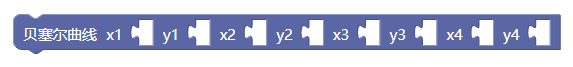
bezier()
示例:

let x = 0;
function setup() {
  createCanvas(100, 100);
}
function draw() {
  background(204);
  x = x + 0.1;
  if (x > width) {
    x = 0;
  }
  line(x, 0, x, height);
}
function mousePressed() {
  noLoop();
}
function mouseReleased() {
  loop();
}
舞台区显示的画布内容如下:

3.2. 曲线
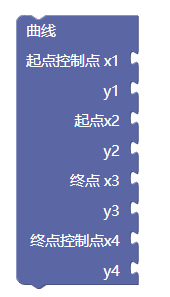
curve()
示例:

let x = 0;
function setup() {
  createCanvas(100, 100);
}
function draw() {
  background(204);
  x = x + 0.1;
  if (x > width) {
    x = 0;
  }
  line(x, 0, x, height);
}
function mousePressed() {
  noLoop();
}
function mouseReleased() {
  loop();
}
舞台区显示的画布内容如下:

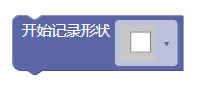
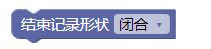
4.2. 结束记录形状
示例:
let x = 0;
function setup() {
  createCanvas(100, 100);
}
function draw() {
  background(204);
  x = x + 0.1;
  if (x > width) {
    x = 0;
  }
  line(x, 0, x, height);
}
function mousePressed() {
  noLoop();
}
function mouseReleased() {
  loop();
}
舞台区显示的画布内容如下:

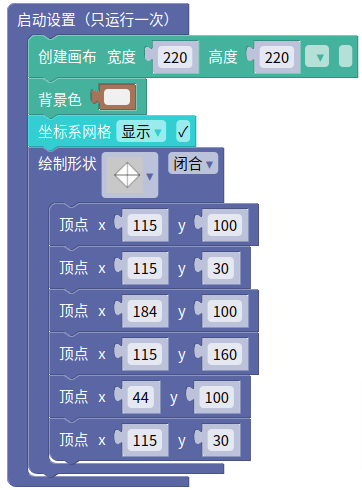
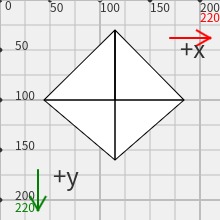
4.3. 顶点(xy)
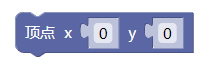
vertex()
示例:

let x = 0;
function setup() {
  createCanvas(100, 100);
}
function draw() {
  background(204);
  x = x + 0.1;
  if (x > width) {
    x = 0;
  }
  line(x, 0, x, height);
}
function mousePressed() {
  noLoop();
}
function mouseReleased() {
  loop();
}
舞台区显示的画布内容如下:

4.4. 顶点(xyz)
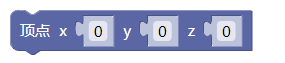
vertex()
示例:

let x = 0;
function setup() {
  createCanvas(100, 100);
}
function draw() {
  background(204);
  x = x + 0.1;
  if (x > width) {
    x = 0;
  }
  line(x, 0, x, height);
}
function mousePressed() {
  noLoop();
}
function mouseReleased() {
  loop();
}
舞台区显示的画布内容如下:

4.5. 顶点(xyzuv)
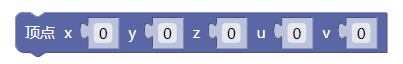
vertex()
示例:

let x = 0;
function setup() {
  createCanvas(100, 100);
}
function draw() {
  background(204);
  x = x + 0.1;
  if (x > width) {
    x = 0;
  }
  line(x, 0, x, height);
}
function mousePressed() {
  noLoop();
}
function mouseReleased() {
  loop();
}
舞台区显示的画布内容如下:

4.6. 定义曲线顶点

curveVertex()
示例:

let x = 0;
function setup() {
  createCanvas(100, 100);
}
function draw() {
  background(204);
  x = x + 0.1;
  if (x > width) {
    x = 0;
  }
  line(x, 0, x, height);
}
function mousePressed() {
  noLoop();
}
function mouseReleased() {
  loop();
}
舞台区显示的画布内容如下:

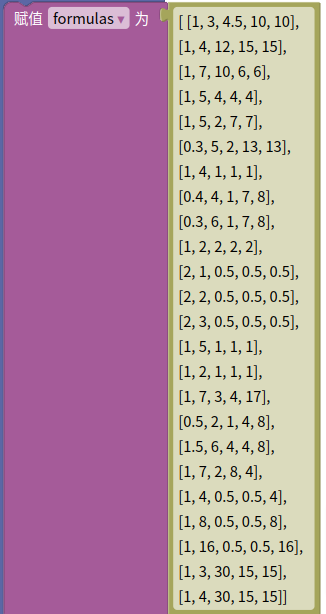
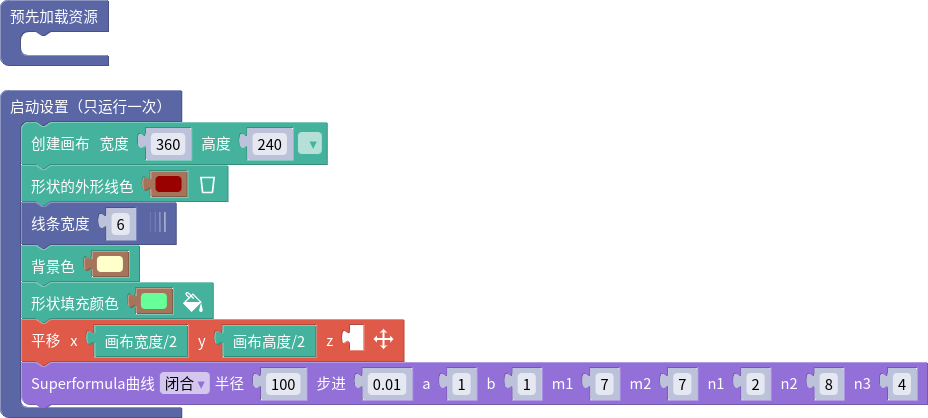
4.7. Superformula曲线
m(顶点数)、n1、n2、n3的值如下所示:
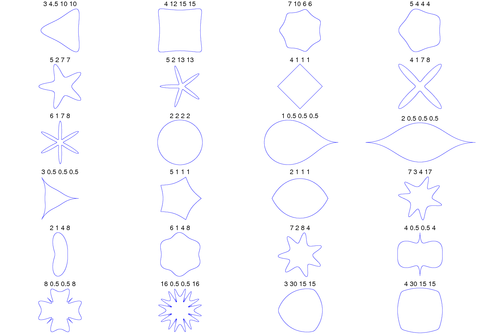
[ [1, 3, 4.5, 10, 10],
[1, 4, 12, 15, 15],
[1, 7, 10, 6, 6],
[1, 5, 4, 4, 4],
[1, 5, 2, 7, 7],
[0.3, 5, 2, 13, 13],
[1, 4, 1, 1, 1],
[0.4, 4, 1, 7, 8],
[0.3, 6, 1, 7, 8],
[1, 2, 2, 2, 2],
[2, 1, 0.5, 0.5, 0.5],
[2, 2, 0.5, 0.5, 0.5],
[2, 3, 0.5, 0.5, 0.5],
[1, 5, 1, 1, 1],
[1, 2, 1, 1, 1],
[1, 7, 3, 4, 17],
[0.5, 2, 1, 4, 8],
[1.5, 6, 4, 4, 8],
[1, 7, 2, 8, 4],
[1, 4, 0.5, 0.5, 4],
[1, 8, 0.5, 0.5, 8],
[1, 16, 0.5, 0.5, 16],
[1, 3, 30, 15, 15],
[1, 4, 30, 15, 15]]
5. 转型
使用flubber实现任意多边形到任意多边形的平滑变化。
5.1. 多边形插值
采用一组点[x,y]坐标作为形状描述的数据。

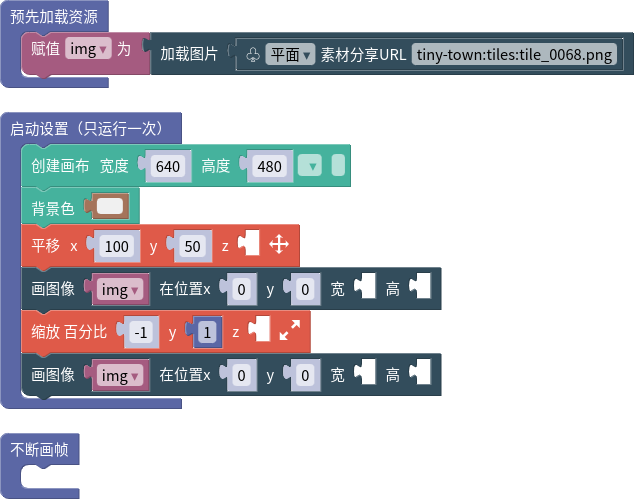
6.1. 平移

translate()
示例:

let x = 0;
function setup() {
  createCanvas(100, 100);
}
function draw() {
  background(204);
  x = x + 0.1;
  if (x > width) {
    x = 0;
  }
  line(x, 0, x, height);
}
function mousePressed() {
  noLoop();
}
function mouseReleased() {
  loop();
}
舞台区显示的画布内容如下:

6.2. 缩放

scale()
示例:

let x = 0;
function setup() {
  createCanvas(100, 100);
}
function draw() {
  background(204);
  x = x + 0.1;
  if (x > width) {
    x = 0;
  }
  line(x, 0, x, height);
}
function mousePressed() {
  noLoop();
}
function mouseReleased() {
  loop();
}
舞台区显示的画布内容如下:

▶️运行示例代码
6.3. 旋转

rotate()
示例:

let x = 0;
function setup() {
  createCanvas(100, 100);
}
function draw() {
  background(204);
  x = x + 0.1;
  if (x > width) {
    x = 0;
  }
  line(x, 0, x, height);
}
function mousePressed() {
  noLoop();
}
function mouseReleased() {
  loop();
}
舞台区显示的画布内容如下:

6.4. 绕着x轴旋转
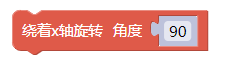
rotateX()
示例:

let x = 0;
function setup() {
  createCanvas(100, 100);
}
function draw() {
  background(204);
  x = x + 0.1;
  if (x > width) {
    x = 0;
  }
  line(x, 0, x, height);
}
function mousePressed() {
  noLoop();
}
function mouseReleased() {
  loop();
}
舞台区显示的画布内容如下:

6.5. 绕着y轴旋转
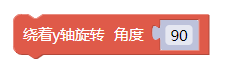
rotateY()
示例:

let x = 0;
function setup() {
  createCanvas(100, 100);
}
function draw() {
  background(204);
  x = x + 0.1;
  if (x > width) {
    x = 0;
  }
  line(x, 0, x, height);
}
function mousePressed() {
  noLoop();
}
function mouseReleased() {
  loop();
}
舞台区显示的画布内容如下:

6.6. 绕着z轴旋转

rotateZ()
示例:

let x = 0;
function setup() {
  createCanvas(100, 100);
}
function draw() {
  background(204);
  x = x + 0.1;
  if (x > width) {
    x = 0;
  }
  line(x, 0, x, height);
}
function mousePressed() {
  noLoop();
}
function mouseReleased() {
  loop();
}
舞台区显示的画布内容如下:

6.7. 形状x轴切变量
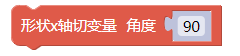
shearX()
示例:

let x = 0;
function setup() {
  createCanvas(100, 100);
}
function draw() {
  background(204);
  x = x + 0.1;
  if (x > width) {
    x = 0;
  }
  line(x, 0, x, height);
}
function mousePressed() {
  noLoop();
}
function mouseReleased() {
  loop();
}
舞台区显示的画布内容如下:

6.8. 形状y轴切变量
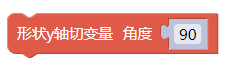
shearY()
示例:

let x = 0;
function setup() {
  createCanvas(100, 100);
}
function draw() {
  background(204);
  x = x + 0.1;
  if (x > width) {
    x = 0;
  }
  line(x, 0, x, height);
}
function mousePressed() {
  noLoop();
}
function mouseReleased() {
  loop();
}
舞台区显示的画布内容如下:

6.9. 矩阵相乘2*3
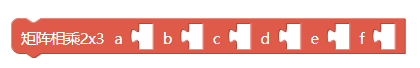
applyMatrix()
示例:

let x = 0;
function setup() {
  createCanvas(100, 100);
}
function draw() {
  background(204);
  x = x + 0.1;
  if (x > width) {
    x = 0;
  }
  line(x, 0, x, height);
}
function mousePressed() {
  noLoop();
}
function mouseReleased() {
  loop();
}
舞台区显示的画布内容如下:

6.10. 矩阵相乘4*4

applyMatrix()
示例:

let x = 0;
function setup() {
  createCanvas(100, 100);
}
function draw() {
  background(204);
  x = x + 0.1;
  if (x > width) {
    x = 0;
  }
  line(x, 0, x, height);
}
function mousePressed() {
  noLoop();
}
function mouseReleased() {
  loop();
}
舞台区显示的画布内容如下:

6.11. 将现有的矩阵替换成单位矩阵

resetMatrix()
示例:

let x = 0;
function setup() {
  createCanvas(100, 100);
}
function draw() {
  background(204);
  x = x + 0.1;
  if (x > width) {
    x = 0;
  }
  line(x, 0, x, height);
}
function mousePressed() {
  noLoop();
}
function mouseReleased() {
  loop();
}
舞台区显示的画布内容如下:
7.1. 平面
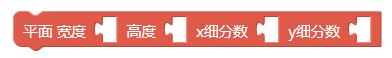
plane()
示例:

let x = 0;
function setup() {
  createCanvas(100, 100);
}
function draw() {
  background(204);
  x = x + 0.1;
  if (x > width) {
    x = 0;
  }
  line(x, 0, x, height);
}
function mousePressed() {
  noLoop();
}
function mouseReleased() {
  loop();
}
舞台区显示的画布内容如下:

7.2. 立方体
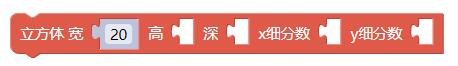
box()
示例:

let x = 0;
function setup() {
  createCanvas(100, 100);
}
function draw() {
  background(204);
  x = x + 0.1;
  if (x > width) {
    x = 0;
  }
  line(x, 0, x, height);
}
function mousePressed() {
  noLoop();
}
function mouseReleased() {
  loop();
}
舞台区显示的画布内容如下:

7.3. 球体
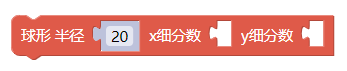
sphere()
示例:

let x = 0;
function setup() {
  createCanvas(100, 100);
}
function draw() {
  background(204);
  x = x + 0.1;
  if (x > width) {
    x = 0;
  }
  line(x, 0, x, height);
}
function mousePressed() {
  noLoop();
}
function mouseReleased() {
  loop();
}
舞台区显示的画布内容如下:


7.5. 锥形
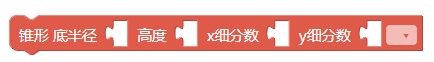
cone()
示例:

let x = 0;
function setup() {
  createCanvas(100, 100);
}
function draw() {
  background(204);
  x = x + 0.1;
  if (x > width) {
    x = 0;
  }
  line(x, 0, x, height);
}
function mousePressed() {
  noLoop();
}
function mouseReleased() {
  loop();
}
舞台区显示的画布内容如下:

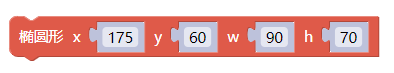
7.6. 椭球形
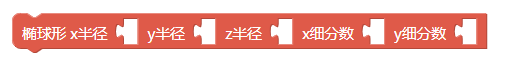
ellipsoid()
示例:

let x = 0;
function setup() {
  createCanvas(100, 100);
}
function draw() {
  background(204);
  x = x + 0.1;
  if (x > width) {
    x = 0;
  }
  line(x, 0, x, height);
}
function mousePressed() {
  noLoop();
}
function mouseReleased() {
  loop();
}
舞台区显示的画布内容如下:


8. 3D模型
3D模型